Equality Fund Impact Library

Duration
6 days, April 2026
UI/UX Designer
Equality Fund
Me (UI/UX Designer), Hugo P (Project manager), Sebastian W (PowerBI Developer)
AI-Assisted Design, Internal Platform,
Problem
How do you design a complex multi-page data portal in days rather than weeks, while keeping every decision in sync with documentation that keeps changing?
Solution
I stopped treating Claude as a generator. I treated it as a collaborator that held the entire document corpus in context. When a new version arrived, I fed it to Claude and asked: what changed, and what does that mean for the screens? That question ran 10 times across the project.

How I started
The Project
The Equality Fund is a global feminist fund. The Impact Library is an internal tool for their staff, one place to find impact data, stories, visualisations, and reporting frameworks. It runs on Power BI. The engagement was four weeks. I worked 1 to 2 days per week on the design, with weekly client meetings and live Figma comments from the client lead, Marine-Celeste, in between. The original scope covered five pages: Dashboard, Grantmaking, Investment, Impact Stories, and Philatrophy. Mid-project, the client reduced it to three. The Imapct Stories and Philanthropy pages were deferred because the data for them wasn't ready yet. That decision came from the client, not from the timeline.


Eight documents: brand guidelines, a master project roadmap, a data mapping, five versions of a messaging copy document, a concept note, a dummy dataset, an endline report template, and a capital continuum deck. PDFs, Excel files, Word documents, PowerPoint decks.
These were not static. The client team updated them throughout the project. Every time a new version arrived, I had to understand what changed and how it should affect the design. Sensitive data has been removed for this case study, but the point is the volume and variety. All of it was loaded into Claude's context. All of it informed the design. Claude could compare any version against any other without losing track of the first document when it read the eighth.

"AI helped me design" is not a useful description. Here is what it specifically did on this project.
Five roles, each with a different function. Document analyst: reading and comparing all 8 documents simultaneously, tracking what changed between versions. Information architect: building the portal's content structure from raw source material. Copy collaborator: tracking draft versions, flagging where new messaging contradicted old. Design executor: applying changes directly in Figma via MCP, no manual copying between tools. Iteration tracker: generating numbered edit lists with source citations before every session.
It also spawned sub-agents. An Explore agent for deep document reading, a Plan agent for structuring each edit session, General-purpose agent for document comparison. And it used Figma skills to translate plans directly into screen changes.

How The Design Process Continued
System Map
The workflow ran as a loop. Documents fed into Claude. Claude read and synthesised the full corpus and produced a structured edit plan: numbered changes, each citing its source document. Those changes were applied directly to Figma via MCP. The result was a design iteration. Then a new document version arrived, Claude re-analysed, and the loop ran again.
This ran 10 times across the project. Every iteration was document-driven. Nothing changed in the design without a source to justify it.



The AI Toolkit

I used three different AI interfaces across the project. The progression matters.
I started with Figma Make for early wireframing. It generates layout quickly, and at that stage the document complexity was low enough for it. By Step 04 I switched to Claude Code. The document corpus had grown to a point where I needed all of it in context during every session, and I needed changes applied directly in Figma without a handoff step. Claude Code with MCP gave me both. It became the primary tool for Steps 4 through 10.
At Step 08 I used Claude Cowork (the chat interface) for a section that needed thinking through before executing. Working section by section in conversation made more sense there than jumping straight into changes. The tool shifted as complexity grew.
Document Table
By Step 10, the context held 8+ documents simultaneously: brand guidelines, roadmap, five messaging drafts, data mappings, dummy datasets, a capital strategy document, an endline report. All of it live. All of it shaping every edit decision. This table is the evidence that the design was document-driven.

Style Guide
The design is not just content-accurate. It is visually aligned with EF's brand from Step 02 onward. Claude was given the Brand Guidelines PDF and the Description of Elements document. It extracted the color palette and typography. Claude maintained the brand consistency it through document context alone.

Design Steps
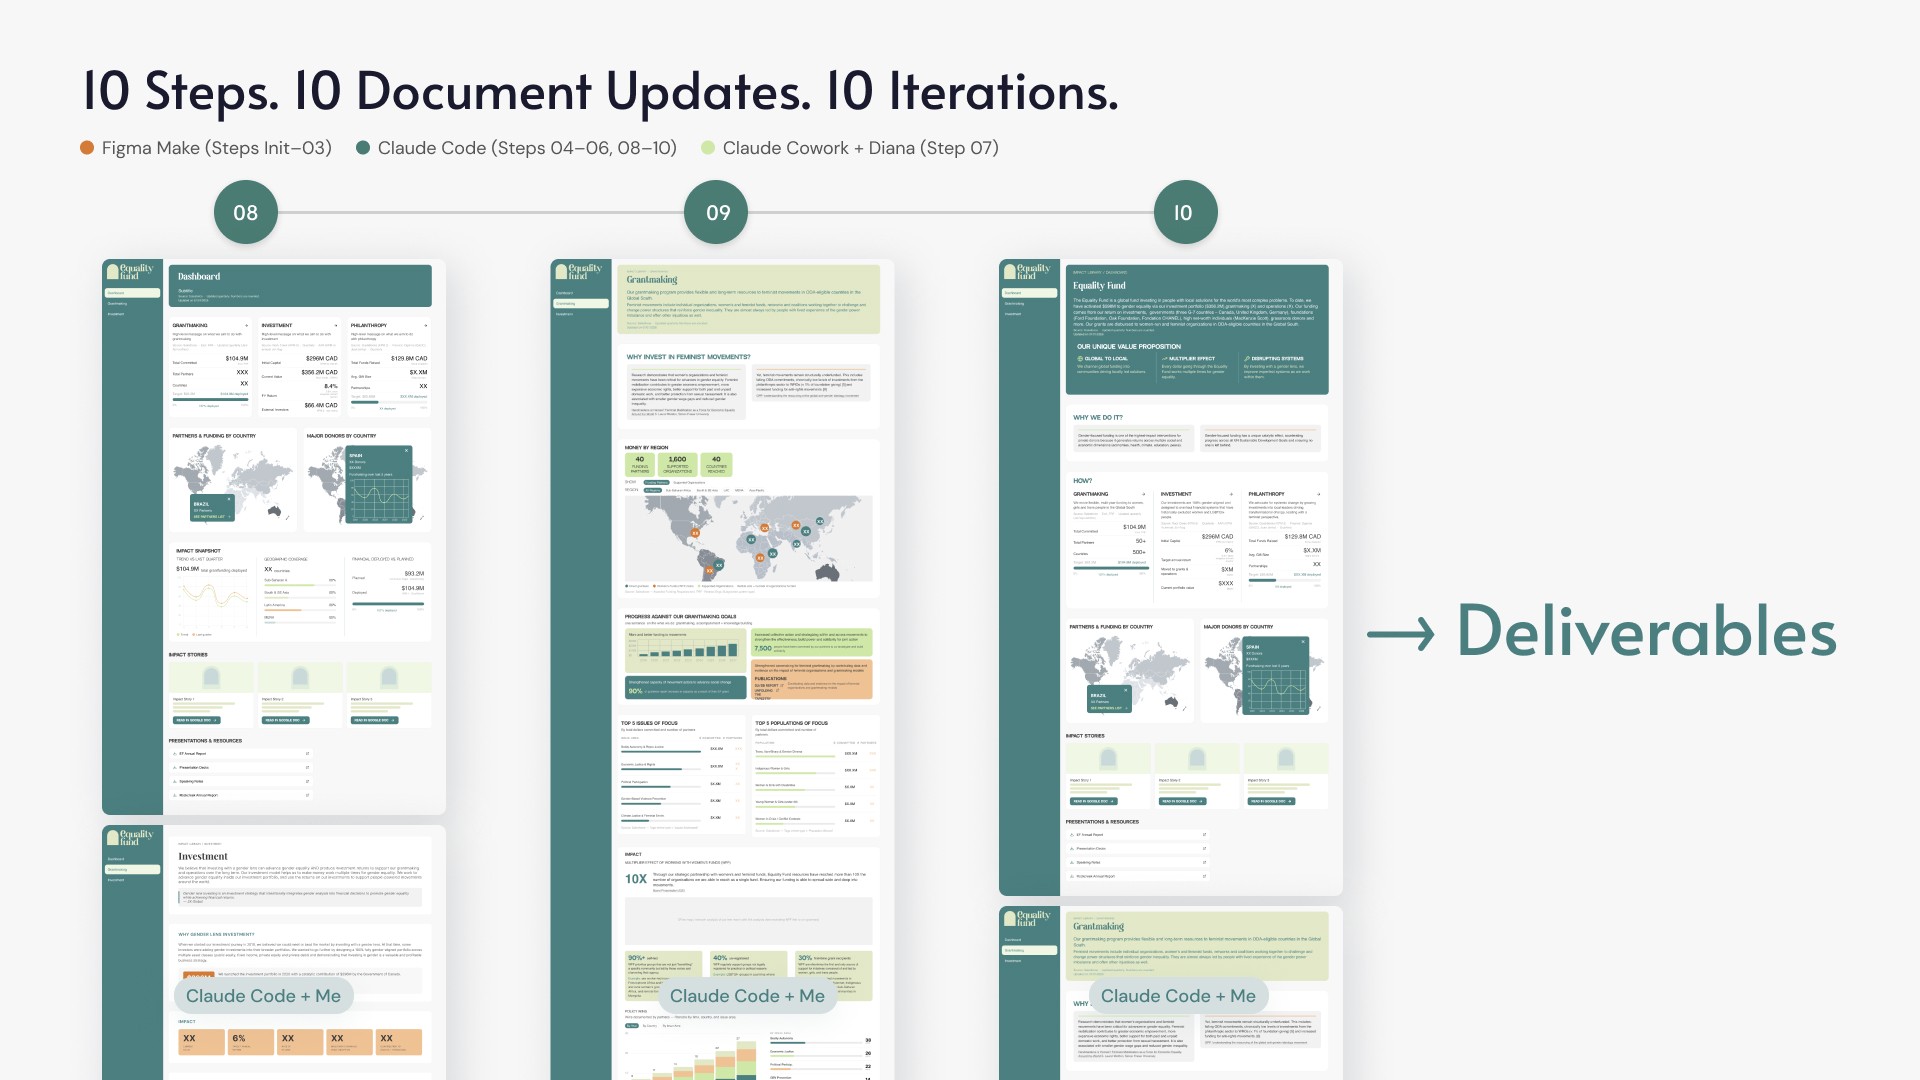
This is the full picture. The tool progression is visible in the color coding: Figma Make for Steps Initial through 03, Claude Code most of the project, the Cowork session at Step 08. Wireframes on the left, hi-fi screens on the right. Each step represents at least one new document added to the context. The design evolved because the documents evolved, not because of a separate creative sprint.
The three slides together show the complete arc: from a blank-slate wireframe at Step 01 with placeholder text only, to fully branded hi-fi with real data visualisations and complete copy at Step 10.


Planning
In Action
One example: the client left comments directly in the Figma file, flagging four sections they wanted to change. I gave Claude the comments and the latest messaging document. It read both, identified where the comments mapped to specific messaging updates, and generated a 16-item edit plan. I reviewed and approved it. Claude applied all 16 edits via MCP. A numbered list of specific changes: the section to update, the exact change to make, and the source document that triggered it. The screenshot on the left is the plan before the session. The same list, all checked, is on the right.
16 edits in one session. This is what accountability looks like in practice: Claude proposes a structured plan, I review and approve it, then the changes happen.


UI Finals
Three final screens: Dashboard, Grantmaking, and Investment.
The Dashboard presents the Equality Fund's overview and value proposition: global-to-local grantmaking model, multiplier effect, and how funding reaches feminist movements. It includes a country-level breakdown of partners and funding. Grantmaking is the most content-heavy page. It covers the rationale for investing in feminist movements, a regional funding map, goal-tracking charts, and reach data. The Investment page covers gender-lens investing strategy, impact metrics, the Continuum of Capital model, and FAQs.


Document
Traceability
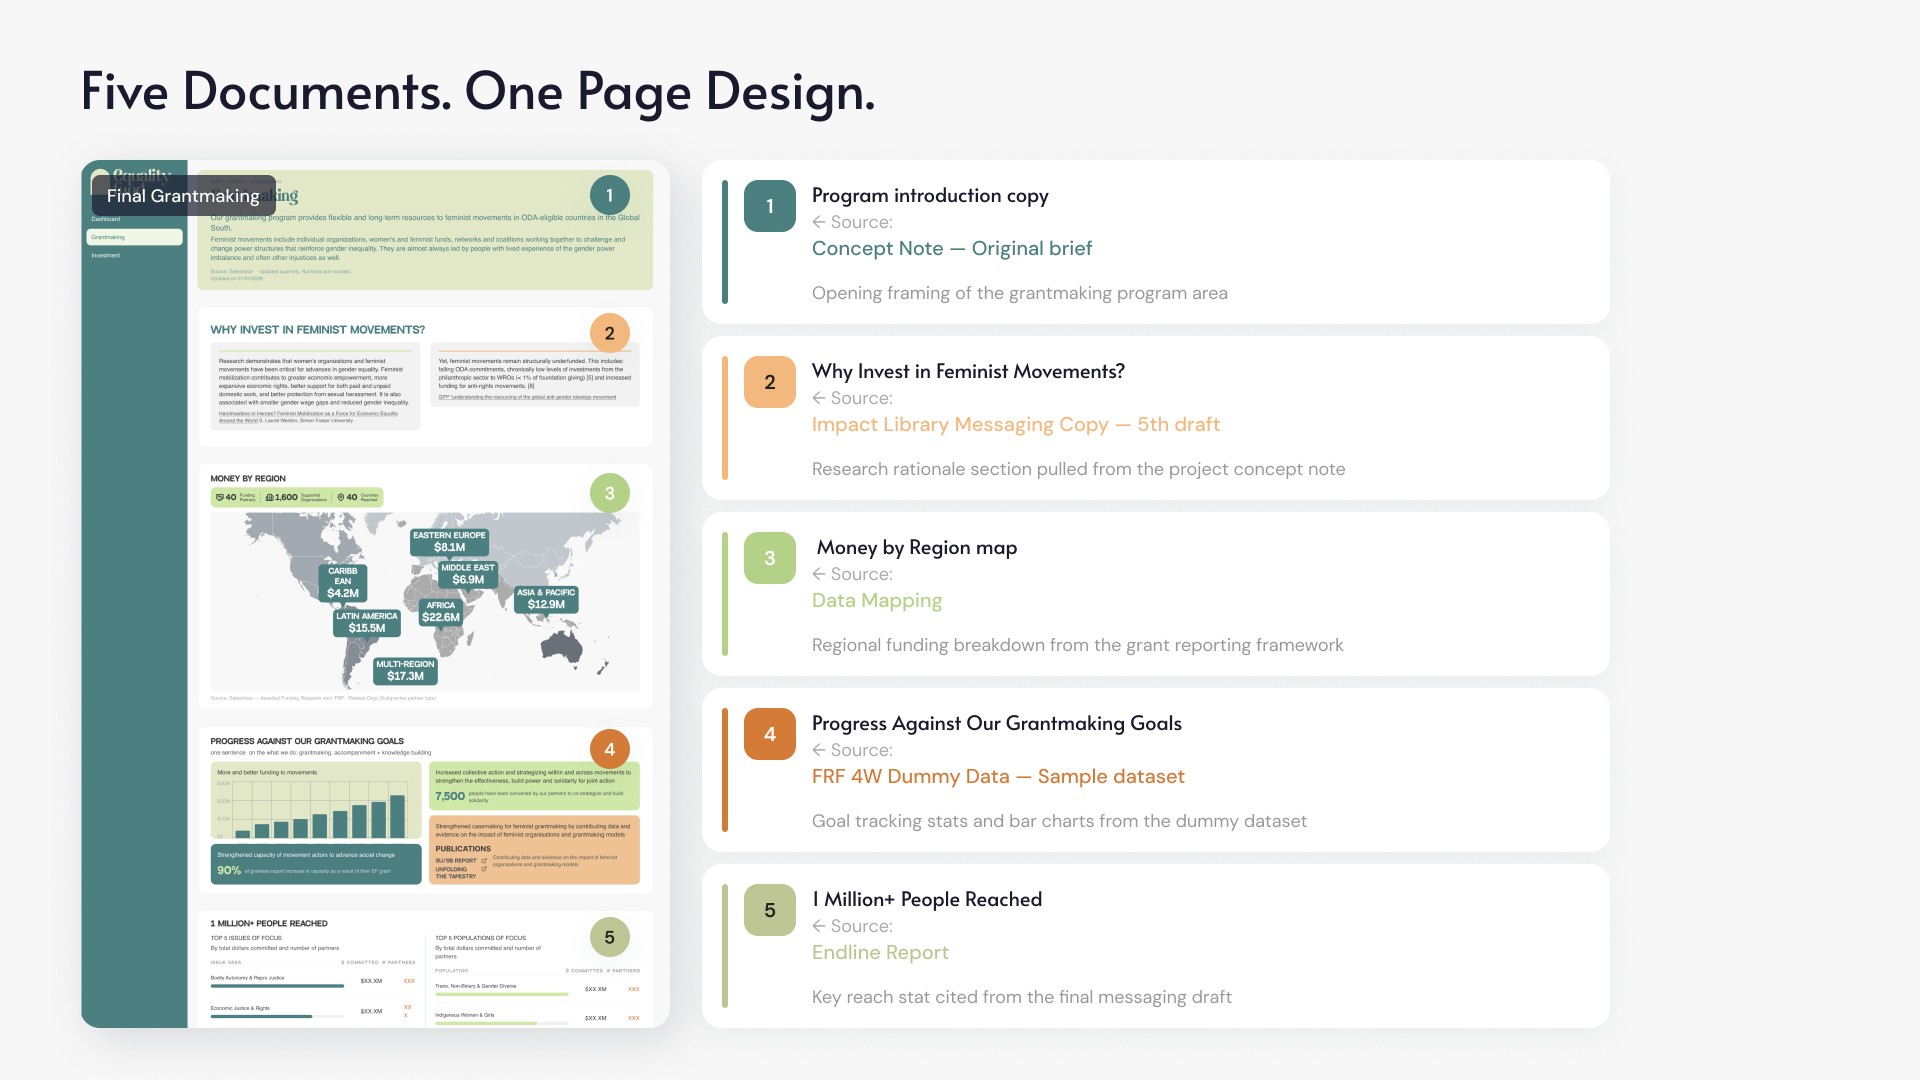
The Final Grantmaking page is on the left. Five numbered callouts on the right trace each section back to its source. Program introduction copy: from the Concept Note, original brief. Why Invest in Feminist Movements?: from the Messaging Copy, 5th draft. Money by Region map: from the Data Mapping document. Progress Against Our Grantmaking Goals: from the FRF 4W Dummy Data sample dataset. 1 Million+ People Reached: from the Endline Report.
One finished page from five different source documents.


The Result
6 days of design work. 10 iterations. 8+ documents analysed. 3 pages delivered (the scope reduced from 5 mid-project). 0 handoffs between Claude and Figma. My estimate for this project without AI-assisted document synthesis would have been 12 to 18 days. The time saved came almost entirely from the re-synthesis loop. Claude did that work. I did the judgment.
The process was 2 to 3 times faster. Every pixel had a source.


Key Takeaways
Three things I'd take from this project to any similar brief. AI excels at synthesis. Reading, comparing, and connecting 8 evolving documents is exactly what it's built for. It's also where designers burn the most time on complex projects. That's where the speed came from, mainly not from faster drawing, but from removing the re-synthesis loop entirely.
